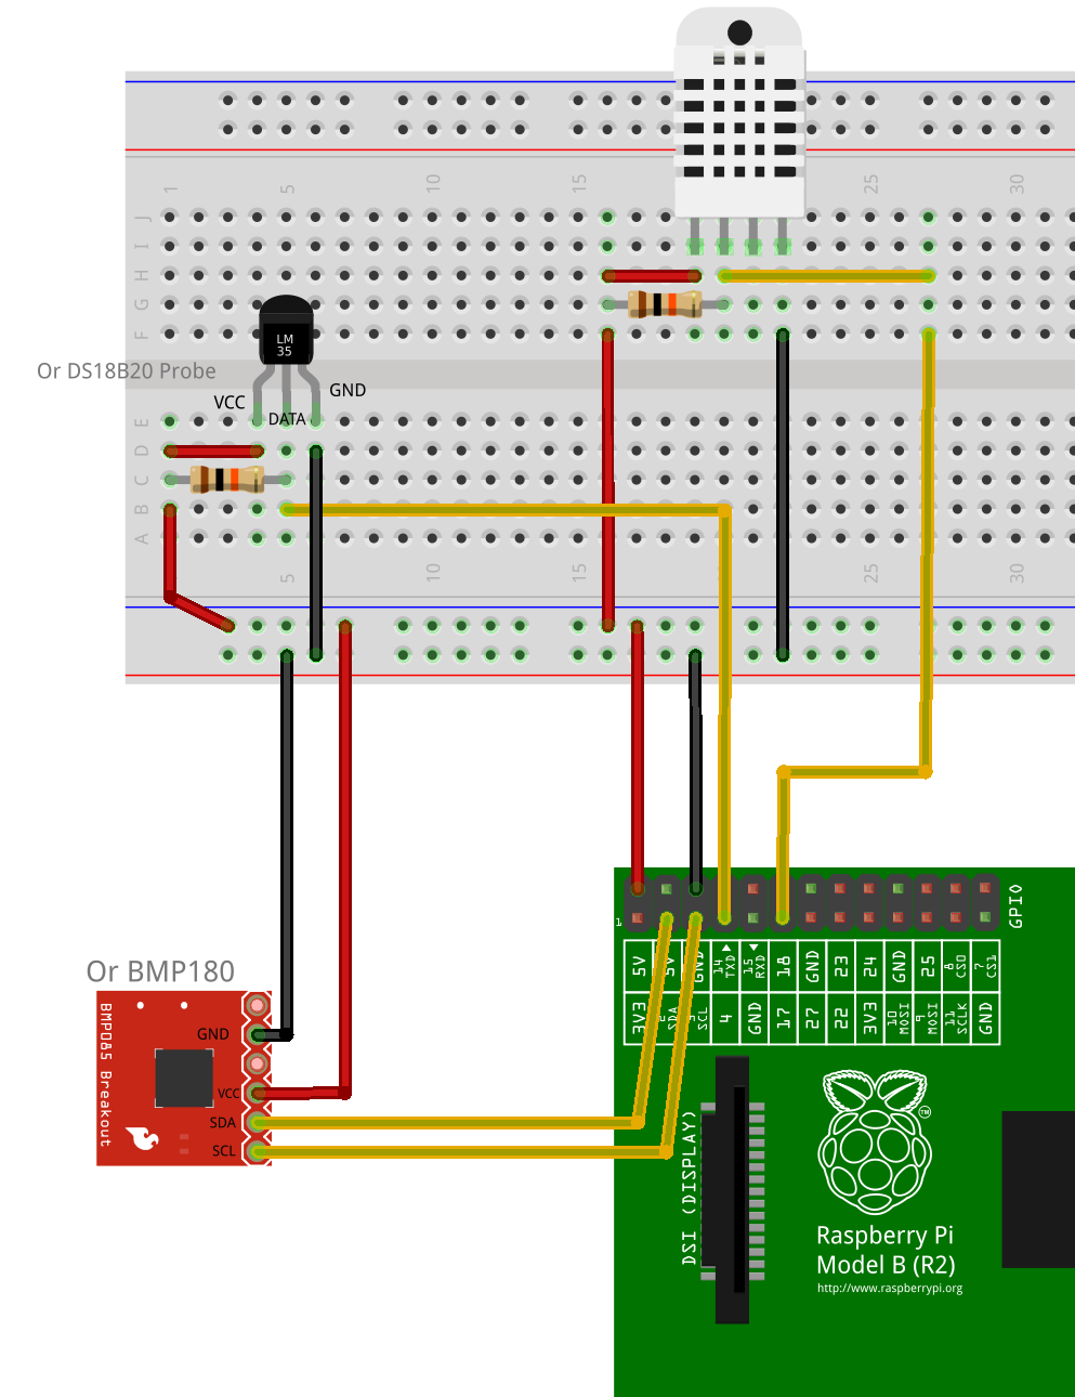
Circuit diagram and code for my weather monitoring system [Raspberry Pi]
12 August 2015 By Bhavyanshu Parasher
Overview
I recently upgraded my weather monitoring system. To those who don’t know, it basically records temperature, humidity, atmospheric pressure etc using various sensors. The sensors are integrated with GPIOs of my Raspberry Pi. Many people have asked me to share the circuit diagram & code for it so here it is. I designed it using Fritzing for linux. The code is still rough but it will give you a basic idea about how it all works. Please figure out the dependencies yourself. I have mentioned important ones though.
Requirements
- Raspberry Pi
- 2 x 10K Ohm Resistors
- Jumper wires
- DS18B20 Temperature Sensor Probe
- DHT11 Temperature & Humidity Sensor
- BMP180 Barometer for Atmospheric Pressure & altitude
Circuit Diagram

Code Snippets
probetemp.py - Code to get temperature using DS18B20 temperature probe
#!/usr/bin/env python
import glob
import time

# should be executed at boot in /etc/modules  or else do it via bash script like shown below.
#os.system('modprobe w1-gpio')
#os.system('modprobe w1-therm')

base_dir = '/sys/bus/w1/devices/'
device_folder = glob.glob(base_dir + '28*')[0]
device_file = device_folder + '/w1_slave'

def read_temp_raw():
    f = open(device_file, 'r')
    lines = f.readlines()
    f.close()
    return lines

def read_temp():
    lines = read_temp_raw()
    while lines[0].strip()[-3:] != 'YES':
        time.sleep(0.2)
        lines = read_temp_raw()
    equals_pos = lines[1].find('t=')
    if equals_pos != -1:
        temp_string = lines[1][equals_pos+2:]
        temp_c = float(temp_string) / 1000.0
        temp_f = temp_c * 9.0 / 5.0 + 32.0
        return temp_c, temp_f

if __name__ == "__main__":
    print '%f, %f'%(time.time(), read_temp()[0])
humidity.py - For DHT11 Humidity sensor use AdaFruit DHT library
import sys
import time
import Adafruit_DHT

path_data_dir = "/home/pi/pathToDataDirectory/"

def writeToFile(humidityval):
        file = open(path_data_dir+"humidity_val.dat", "w")
        file.write(str(humidityval))
        file.close()

humidity, temperature = Adafruit_DHT.read_retry('11', '17')

if humidity is not None and temperature is not None:
	#print 'Temp={0:0.1f}*C  Humidity={1:0.1f}%'.format(temperature, humidity)
	print '{0:f}, {1:0.1f}'.format(time.time(),humidity)
	writeToFile(humidity)
else:
	print 'Failed to get reading. Try again!'
pressure.py - For BMP180 sensor, use Adafruit BMP Lib
import Adafruit_BMP.BMP085 as BMP085

sensor = BMP085.BMP085()
def getpressure():
	strP = '{0:0.2f} mmHg'.format(sensor.read_pressure()*0.00750061683)
	strAlt = '{0:0.2f} m'.format(sensor.read_altitude())
	return strP+" at "+strAlt
plotter.py - Next we need to plot graphs using the data stored in each .dat file. Also, we will be tweeting the update. Make sure you put your twitter API keys. Also this is heavily dependent on matplotlib and tweepy. So make sure you
pip installthem.
#!/usr/bin/env python

import io
import numpy as np
import tweepy
import sys
import matplotlib
import random

matplotlib.use('Agg')
matplotlib.rcParams['timezone'] = 'Asia/Kolkata'  # Replace with your time zone

import matplotlib.pyplot as plt
from pytz import timezone
import pytz
from matplotlib.dates import DateFormatter
from probetemp import read_temp
from pressure import getpressure
from datetime import datetime

# Twitter API Keys
CONSUMER_KEY = ''
CONSUMER_SECRET = ''
ACCESS_KEY = ''
ACCESS_SECRET = ''

# Set file paths - Don't forget trailing slash

path_data_dir = "/home/pi/pathToDataDirectory/"
path_image_dir = "/home/pi/pathToImageDirectory/"

# Read the data file

## Plot temperature graph
data = np.genfromtxt( path_data_dir+'probetemp.dat', delimiter=',')
dates = matplotlib.dates.epoch2num(data[:,0])
tempdata = data[:,1]
fig, ax = plt.subplots(figsize=(6,5))
ax.plot_date( dates, tempdata, ls='-', color='blue' )
ax.xaxis.set_major_formatter( DateFormatter('%d/%m/%y %H:%M'))
ax.set_ylabel('Temperature C')
for label in ax.get_xticklabels():
    label.set_rotation(60)
plt.tight_layout()
plt.savefig(path_image_dir+'probetemplot.png', bbox_inches='tight')

## Plot humidity graph
datahumidity = np.genfromtxt(path_data_dir+'humidity.dat', delimiter=',')
dateshum = matplotlib.dates.epoch2num(datahumidity[:,0])
tempdatahum = datahumidity[:,1]
fighum, axhum = plt.subplots(figsize=(6,5))
axhum.plot_date( dateshum, tempdatahum, ls='-', color='green' )
axhum.xaxis.set_major_formatter( DateFormatter('%d/%m/%y %H:%M'))
axhum.set_ylabel('Humidity %')
for label in axhum.get_xticklabels():
    label.set_rotation(60)
plt.tight_layout()
plt.savefig(path_image_dir+'humidity.png', bbox_inches='tight')

## Plot combined graph of humidity and temperature to tweet using tweepy
figuremain = plt.figure(figsize=(8, 6), dpi=80)
ax = figuremain.add_subplot(211)
ax.plot_date( dates, tempdata, ls='-', color='blue' )
ax.xaxis.set_major_formatter( DateFormatter('%d/%m/%y %H:%M'))
ax.set_ylabel('Temperature C')
for label in ax.get_xticklabels():
    label.set_rotation(60)
axhum = figuremain.add_subplot(212)
axhum.plot_date( dateshum, tempdatahum, ls='-', color='green' )
axhum.xaxis.set_major_formatter( DateFormatter('%d/%m/%y %H:%M'))
axhum.set_ylabel('Humidity %')
for label in axhum.get_xticklabels():
    label.set_rotation(60)
plt.tight_layout()
plt.savefig(path_image_dir+'combined.png', bbox_inches='tight')

# Get latest humidity value from file
file = open(path_data_dir+'humidity_val.dat', 'r')
humval = file.read()
file.close()

## Tweet or Print!
auth = tweepy.OAuthHandler(CONSUMER_KEY, CONSUMER_SECRET)
auth.set_access_token(ACCESS_KEY, ACCESS_SECRET)
api = tweepy.API(auth)

tz = timezone("Asia/Kolkata")
ftime = datetime.now()
finaltime = tz.localize(ftime)
photo_path = path_image_dir+'combined.png'
cel = read_temp()[0]
temp = u"City: %.2f\u2103 | "%cel

status = temp+" Humidity "+humval+"% - (IST) "+finaltime.strftime('%d/%m/%Y %H:%M:%S')+" | Atmospheric pressure: "+getpressure()
status = status.encode('utf-8')
api.update_with_media(photo_path, status=status)
#print status
execmain.sh - Finally, the bash script which is run via cron. Change directories or file names as per your requirement.
#!/bin/bash
sudo modprobe w1-gpio
sudo modprobe w1-therm

#Change directory paths here. No trailing slashes needed.
DATADIR="/home/pi/pathToDataDirectory"
SCRIPTDIR="/home/pi/pathToDirectoryWithScripts"

#Change file names if in case you used different file names.
echo `python "$SCRIPTDIR/probetemp.py"` >> "$DATADIR/probetemp.dat";
echo `python "$SCRIPTDIR/humidity.py"` >> "$DATADIR/humidity.dat";

if [ $? -eq 0 ]; then
	if echo `python "$SCRIPTDIR/plotter.py"`; then
		sleep 1
		#Do something else here. Like auto upload to images to server using ftp?
	else
		echo INFAIL
	fi
else
	echo FAIL
fi
These are all the core files. Please change the file paths. I did not get time to make it path independent. Since it has to be made to run via cron job so I thought specifying paths would be better. If I make any changes I will update them here as well. Till then, you will have to add proper paths in scripts.
Result
Gurgaon City: 32.06℃ | Humidity 60.0% - (IST) 12/08/2015 20:00:55 | Atmospheric pressure: 732.52 mmHg at 310.64 m pic.twitter.com/Vudw68Fn5t
— GurgaonWeather (@GurgaonWeather) August 12, 2015This is the tweet generated by the weather system. I will add more components to it. I will keep updating this with more information. Leave a comment if you wanna ask anything about it.
Note: I am a computer science engineer with interest in electronics so please excuse my technical errors in designing circuit diagrams :)
blog comments powered by Disqus